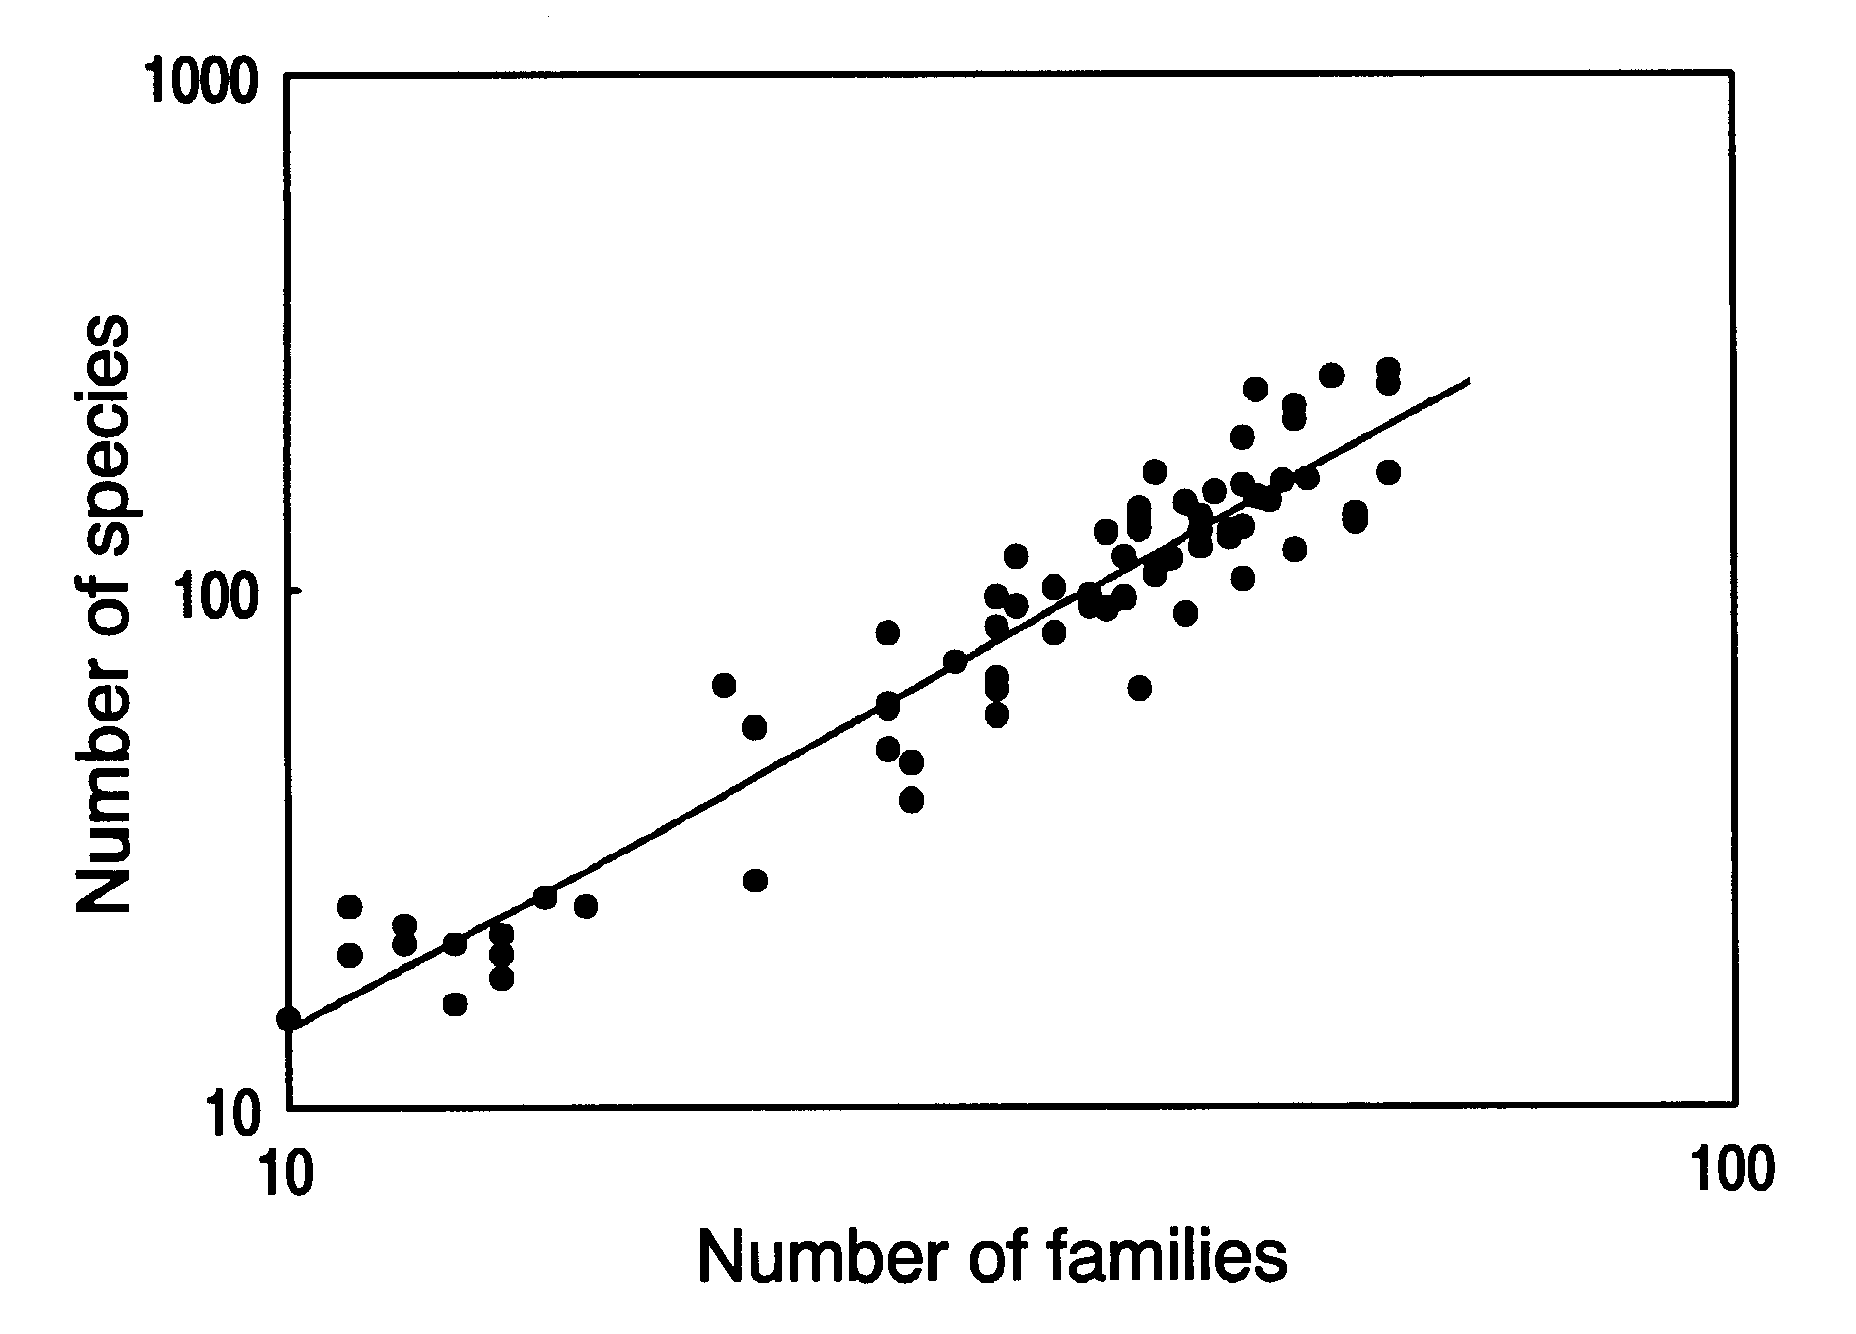
Several studies now support the idea of a relationship between the numbers of higher taxa, such as families, and the numbers of species among areas (ref 10). Evidence at large spatial scales is very difficult to collect. The largest comparable dataset available for plants comes from the work of the late Alwyn Gentry, and this does support a predictive relationship for patches among continents (log-transformed on both axes, r² = 0.91) (ref 7) (below):

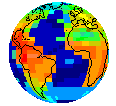
In the absence of direct counts of plant species richness, if this kind of relationship can be assumed, then the example can use counts of the numbers of seed plant families (from a total of 395) to represent relative variation in the numbers of species (from a total of c. 300,000) expected among equal-area grid cells (each cell c. 611,000 km2), with red for high richness and blue for low richness (below):
 |
Link to image showing plant family richness. |
Other uses of surrogacy for measuring biodiversity value include using environmental factors that are likely to govern the distribution of biodiversity, such as the net primary productivity of the indigenous vegetation. One drawback of this approach is that, unlike higher taxa, there is no information from productivity estimates on the spatial turnover of groups of organisms among areas. Another problem is that the governing relationships may not always be conveniently linear. However, the geographic distribution of deviations from the relationship between plant family richness and net primary productivity (taken here from the published values modelled by Uchijima & Seino) can be investigated by overlaying estimates for the two in two separate colours (ref 14). The example uses green for plant family richness and blue for the productivity scores, so that black grid cells on the map show low values for both, white shows high values for both, grey shows similar values for both (these scores lie on the diagonal of the colour key, to the upper right), green shows an excess of plant families over productivity, and blue an excess of productivity over plant families (Spearman correlation coefficient rho= 0.85) (below):
 |
Link to image showing overlay comparison between plant family richness and primary productivity. |