3=Ecology
4=Systematics
5=Plant Physiology
9=Genetics
11=Economic Botany
13=Mycology
18=Phycology
19=Paleobotany
20=Bryology
24=Pteridology
Botany for the Next Millennium:
Copies of the questionnaires and complete survey results are available from the Botanical Society of America, Business Office. The data include information on employment status, types of positions held and place of employment, salary levels, time distribution (among teaching, research, administration, service), sabbatical locations, numbers of undergraduate and graduate students and postdoctoral students and their employment success. Thirty percent of the respondents were women and 70 percent men. The results of selected survey questions follow.
Question 1 -- Following is a list of societies cooperating in this survey of botanists, or plant biologists. With which of these societies are you affiliated?
Question 2 -- With which group listed below do you most closely identify?
These data are the essential demographics in terms of society and group affiliations. Question 1 reveals that although most respondents belong to two or more of the cooperating societies, close to 90 percent of the total number belong to the Botanical Society of America.
Question 2 reveals that 64 percent of 1,200 people responding to this question list just four groups or sections as their primary affiliation (in order): Ecological (21 percent), Systematics (18 percent); Developmental/Structural (14 percent), and Physiological (11 percent).
Question 3 -- In what year did you receive your highest degree?
This question reveals that the respondents constitute a relatively young group. Fifty percent received their highest degree in 1979 or later, 26 percent in 1987 or later.
| |
|---|---|
| 2=Introductory Botany 3=Ecology 4=Systematics 5=Plant Physiology 9=Genetics 11=Economic Botany |
12=Developmental Biology 13=Mycology 18=Phycology 19=Paleobotany 20=Bryology 24=Pteridology |
A. In the far left box, check ("check mark') the courses that you teach on a regular basis,
B. Indicate whether each of the courses you have checked is a lab course, and
C. Check the appropriate column(s) to indicate the level(s) at which the course is taught.
Do not include seminars or senior theses.
The majority of respondents was committed to teaching introductory biology or botany followed by ecology and systematics, plant physiology, and morphology.
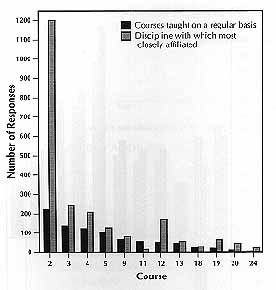
Questions 2 & 20 combined -- Some of the data from these two questions were plotted to explore whether people were teaching courses in the area of their expertise "affiliation."
Interestingly, there is a reasonable correspondence between the number of people teaching the various courses and the number of people affiliated with the discipline reflected by the courses they teach. Note, however, that only 225 of the 1,200 respondents teach Introductory Botany. Also, it appears that there are a lot more "developmentalists" than individuals teaching this kind of course.
Question 23 -- How many courses do you teach each session in a year? Semester System: Fall, Spring, Summer
OR
Quarter System: Fall, Winter Spring, Summer
The average number of courses taught during the academic year: 1.5 per semester, 1 + per quarter. Only respondents who identified the Teaching Section as their primary affiliation reported heavier teaching loads: 2.5 per semester, 1.5 per quarter.
Question 24 -- In general, how have the enrollments in the courses you teach changed over the past 5 years?
Only 8 percent reported that enrollments had definitely decreased. Forty-five percent reported that enrollments had definitely increased.
 |
|---|
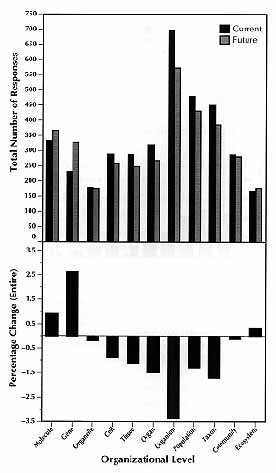
Question 30 -- In the disciplines in which you are conducting research, indicate the organizational level(s) at which you are currently conducting research and, if applicable, indicate the organizational level(s) at which you would like to work or obtain collaboration in the future. Place a check ("check mark") in the appropriate boxes.
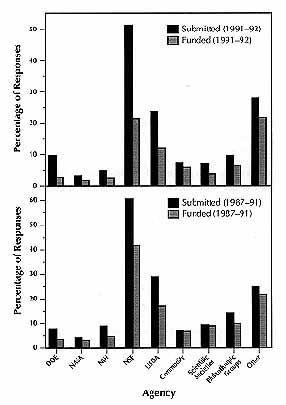
These data indicate what the respondents are doing now and what they intend or hope to do in the near future. Note that although there will likely be a shift away from "cell-to-taxon" in favor of both ends of the spectrum ("molecular-gene" and "ecosystem"), the percentage change appears to be trivial. Question 33 -- How many grant proposals did you submit in academic year 1991-92? How many were funded, not funded or are pending for 1991-92? How many grant proposals did you submit and how many were funded in academic years 1987-91?
The National Science Foundation is the primary agency of submissions, receiving more than twice (2.37) as many as the U.S. Department of Agriculture and at least six times as many proposals as any other agency or grouping. Members of the bryology section submitted fewer proposals to NSF in 1991-92 (0.47) and those of the systematics section more (0.95) than the membership at large (0.75). Considering proposals to all sources, slightly more than two per respondent were submitted in 1991-92. Note that the ratio of funding to submission has decreased for NSF. Although there naturally are many mitigating factors (for example, the pressure to submit grant applications may increase
 |
|---|
Question 51 -- What barriers, if any, may impede research progress in botany, or plant biology, at your institution?
Seventy-two percent of the individuals responding to this question checked "insufficient financial support for research" as a barrier to research progress, and over 50 percent checked "insufficient financial support for graduate students" as a barrier.


