Botany online 1996-2004. No further update, only historical document of botanical science!
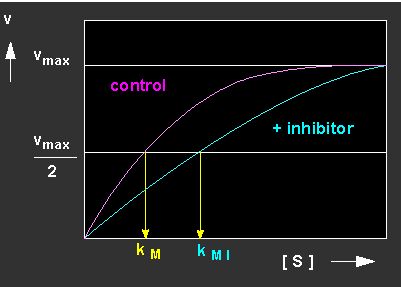
A number of molecules have structures similar to substrate molecules. They are termed inhibitors (I) because they are, just like a substrate molecule, bound to the active centre of the enzyme though their chemical properties render it usually impossible for the enzyme to turn them over. They compete with the original substrate for the same binding site. Often, their affinity to the enzyme is much higher than that of the substrate, so that it is displaced effectively. The enzyme molecules are thus to a large degree inactivated by the binding of the inhibitor. This type of inhibition is termed competitive inhibition. It is explained by the following reaction kinetics.
The kinetics reveal that the value of the kM has risen, since substantially more EI- than ES-complexes are formed. The effect of the inhibitor is thus directly linked to its concentration and the [substrate] / [inhibitor] ratio.
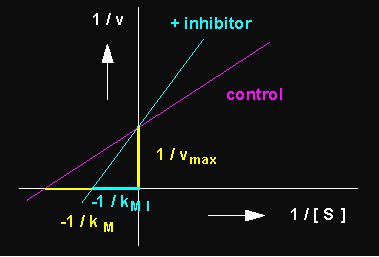
Picture to the left: Reduction of the turn-over velocity of an enzyme-catalyzed reaction by a competitive inhibitor (competitive inhibition; blue curve: inhibited reaction, red curve: control, not inhibited). Picture to the right: Competitive inhibition depicted according to Lineweaver and Burk.
A second type of inhibitor causes non-competitive inhibitions. It is not bound to the catalytic but to some other site of the enzyme. The binding distorts the enzyme's structure effecting also the catalytic binding site so that the substrate molecule does not fit as snugly as before. As a result, less substrate is turned over. The kM remains unchanged, since the substrate concentration has no influence on the effect of the inhibitor.


Picture to the left: Reduction of the turn-over ratio of an enzyme-catalyzed reaction by a non-competitive inhibitor. In non-competitive inhibitions is vmax reduced, while kM stays unaltered. Picture to the right: Non-competitive inhibition depicted according to Lineweaver and Burk.
The effect of some inhibitors is reversible, i.e. after washing them off, the former state is restored. Others denature the enzyme's structure irreversibly so that their effect cannot be compensated for.
Inactivation can be achieved either chemically, i.e. by molecules
or by physical factors like temperature, short waves, etc. This is
also the reason for the characteristic
temperature optimum every enzyme
has: turn over ratio and enzyme inactivation are conflicting,
temperature-dependent processes.
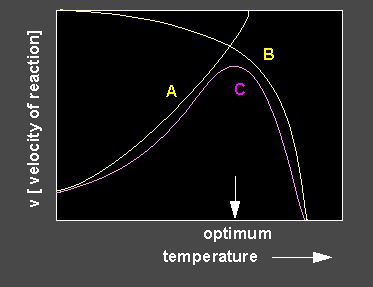
An optimum curve (lilac) is the result of enhancing and inhibiting influences. A rise of the temperature leads at first to an increase of the enzyme activity, a further increase of the temperature causes denaturation of the enzyme that decreases the turn-over. Optimum curves are only rarely symmetrical. An enhanced decrease of the activity is common.
If an enzymatic reaction is carried out at different temperatures, a
number of curves of different kinetics will be obtained.
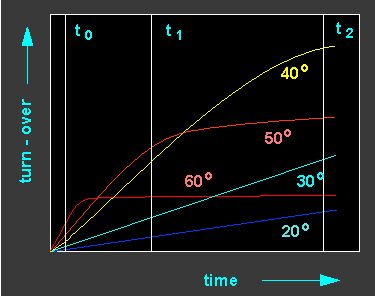
Different turn-over ratios of an enzyme at different temperatures. The turn-over ratio increases with increasing temperature but the thermal inactivation of the enzyme increases, too. Consequently, an optimal temperature range for an enzyme activity (the value s specific for every enzyme) exists. Yellow curve: Reaction at 40 şC, orange: 50 şC, light blue: 30 şC, red: 60 şC, dark blue: 20 şC.
The diagram shows that the bending of the turn-over time curve
becomes the more distinct the higher the temperature. That shows that
all enzyme molecules in the solution are fully active at the
beginning of the reaction and that they display increased turn-over
ratios (compared to values obtained at lower temperatures). But
gradually more and more molecules are degenerated by the temperature.
Accordingly is the temperature optimum the lower the longer the
duration of the reaction. At a rather high temperature (like, for
example, already at 37 °C) an enzyme can work intensely for a
short time, but it has constantly to be replaced by newly synthesized
enzyme molecules to meet the necessary requirements of the cell. The
following picture shows that a whole range of parameters useful for
the understanding of turn over ratios can be derived from reaction
kinetics.
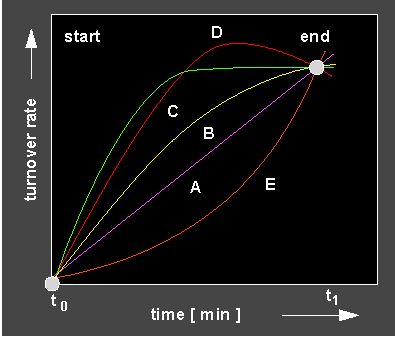
Different reaction kinetics. The shape of the kinetic allows to draw the following conclusions: lilac curve: Linear reaction = constant reaction velocity, yellow and green curve: Increasing slowing down of the reaction: the reaction is either outbalanced by an inactivation or the reaction becomes slower as a result of the decreasing amount of substrate. Red curve: Disturbance of the reaction by a turn-over into the wrong direction. Orange curve: Autocatalytic curve (positive feed-back, see next section).