BIOMAPS - Biodiversity Mapping for Protection and Sustainable Use of Natural Resources
Dept. of Botany, University of Bonn, Germany


| Department of Botany |
| Division of Systematics and Biodiversity |
|
|
BIOMAPS - Biodiversity Mapping for Protection and Sustainable Use of Natural ResourcesDept. of Botany, University of Bonn, Germany  |

|
|
a)
 b) b) |
Comparison
of species numbers of vascular plants (following WRI 1997) to a) the sum
of species numbers of tetrapods on the country level (by WRI 1997), b)
estimated species numbers of insects for different regions (countries,
archipelagos) world-wide (based on Table 4.5 in Gaston 1996)
[after Barthlott, Kier & Mutke 1999] |
 Despite
the amount of accumulated data on vascular plants, only relatively few
survey studies on continental and global scales have been carried out.
In 1996, we published a first world map of the species
numbers of vascular plants.The
six diversity maxima are all located in the humid tropics and subtropics.
Additional centres can be found in Mediterranean-type regions, especially
South Africa. The map was refined and published together with a terminological
discussion on the diversity
of introduced organisms in early 1999 (Abstract).
It is based on approximately 1,400 records taken from literature and shows
the species diversity of vascular plants on a standard area of 10,000 km2.
The species numbers have been calculated for the standard area using the
equation of EVANS et al. (1955) under the simplified assumption of a uniform
species-area-relation word-wide. For a complete revision of the map
which will be finished in mid 1999, we are using the species-area-model
of ARRHENIUS (1920, 1921) since it offers the possibility of a differentiated
calculation by including parameters for spatial heterogeneity.
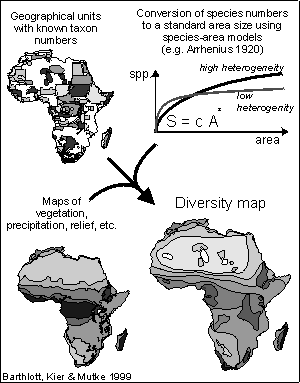
| Biodiversity mapping methods can be
allocated to two basic approaches (compare Barthlott et al. 1999). In a
taxon based approach the diversity map is the result of overlaying
(i.e. adding) data on the individual taxa. On the other hand, approaches
based on summary data for geographical units (inventory based approaches)
allow the direct processing of these summary data for different regions.
Both strategies involve, to a different extent, a reduction of information.
For the inventory based approach, which is used in the case of the world map of the species numbers of vascular plants, data such as total species or family numbers in a region, but also taxon numbers of selected groups are recorded. These numbers may be estimated relatively reliably by specialists long before all involved taxa are exactly and systematically assessed. After standardisation of taxon numbers of regions of different sizes to a defined area size, diversity maps can be created in a rather short time and the centres of diversity can be delineated. Since the data structure is often strongly determined by political units, it is necessary to adjust the boundaries of diversity zones by superimposition with vegetation maps and data sets on physical geofactors (compare fig.) |
 |
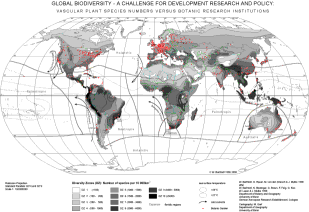 The
relevant potential for biodiversity research exists to a large extent in
the industrialised nations. Besides a large number of research institutions,
a considerable rate of ex-situ diversity is available: collections and
gardens contain about 80,000 species or 33 % of all described species and
85 % of the families of vascular plants (BARTHLOTT et al. 1999). Moreover,
an enormous potential is at the individual nations' disposal with respect
to herbariums and zoological collections. The in-situ diversity by contrast
is largely located in the tropics, i. e. above all in the developing countries.
This discrepancy is shown in the map, where the distribution of more than
500 significant botanical gardens is indicated in comparison to the species
richness of vascular plants (BARTHLOTT
et al. 1999). This situation results not only in great chances but
also in considerable responsibilities.
[after Barthlott, Kier & Mutke 1999] |
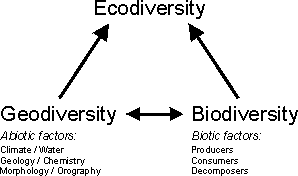
The biodiversity of a region is, apart from historical factors, also particularly a result of its geodiversity (the diversity of abiotic factors). Geodiversity constitutes, in addition to its mostly biodiversity-increasing effect, a quality of an area in its own right of the same order as biodiversity (compare BARTHLOTT et al. 1996). The total diversity of a region, which is a combination of biodiversity and geodiversity, is defined as ecodiversity in accordance with a landscape-ecological concept which subsumes and contrasts the biotope and the geotope under the term 'ecotope'.The alternative geographical term of 'landscape diversity' should not be used as in biodiversity research it is generally defined as a synonym for the gamma-diversity in the system of WHITTAKER. |
An indispensable basis for its description is a suitable terminology.
Indeed, there are plenty of terms like "neophytes","neozoa", etc. However,
terms for to the corresponding diversities such as the diversity of neophytes
have been missing so far. In order to fill this gap we proposed a terminology
system - partly based on existing terms - on a meeting in Helsinki in 1997
(Barthlott et al. 1999, Abstract):
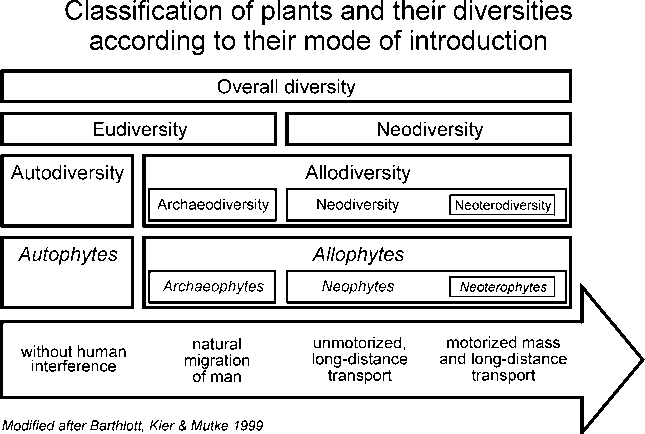 |
First of all, the indigenous (autochtonous) taxa or autophytes (all taxa that evolved in an area or immigrated without the direct or indirect assistance of man; they form the autodiversity) should be distinguished from the introduced (allochtonous) taxa or allophytes (taxa imported into a given area by man; they form the allodiversity).
The latter are separated into archaeophytes and neophytes, according to the time of their immigration. The terms archaeophytes and neophytes have been established in literature for quite some time. Usually the discovery of America or simply the year 1500 is set as an arbitrary dividing line between these two groups. This limit can certainly be assumed to be useful for Europe but cannot be transferred to the whole world without causing problems. Hence we propose a definition for these groups which is oriented at the mode of introduction rather than at the time of introduction. We define archaeophytes as taxa whose area has been extended due to the natural migrational movement of man. They form archaeodiversity. Neophytes include all taxa dispersed by man over large distances, usually resulting in distribution gaps. They form neodiversity.
In the context of motorised mass transportation, since the end of the last century, the problem of introduced and invasive taxa has reached a new dimension. We therefore see the necessity to distinguish this group of taxa within the neophytes and propose the term neoterophytes for its description (from: neos - Greek for new, fresh; particularly in its comparative form: revolutionary, subversive). These taxa are characterised by the fact that their area has been extended in the course of the motorised mass and long distance transportation since the end of the nineteenth century. They form the neoterodiversity as a part of neodiversity.
As it is often problematic to separate archaeophytes from autophytes, we propose the term eudiversity (from: eu - Greek for true, right) for the sum of the archaeodiversity and the autodiversity. This seems to be reasonable under the aspect of nature conservation as well. The opposite of eudiversity is neodiversity (including neoterodiversity).
The different categories in the terminology presented above reveal the equalling effects of "biological globalization". In areas with floras significantly changed by man, such as Hawaii or Florida, many autochthonous and possibly unique species are endangered or already extinct while the overall species number is greater than before (e.g. Cronk & Fuller 1995). In the course of this globalization, many genetic resources are lost and substituted by a handful of weeds. These changes should be recognised in the language of biodiversity.
1. Taxon richness. The majority of investigations here concentrates on the number of species. However, for different questions particularly in the area of biogeography and evolutionary research the genus or family number is also significant.
2. Abundance structure. The share of the number or biomass of individuals per species is discussed in various approaches. With regard to the rarity with respect to local population size (RABINOWITZ 1981, GASTON 1996) the abundance of a species is compared to the abundance of other species. By contrast, the evenness (PIELOU 1975, HAEUPLER 1982) of the distribution of individuals over the species is a characteristic of the whole observed species community in the area of investigation. Evenness can be combined with species richness in diversity indices (e. g. Shannon-Index). As the abundance distribution of a systematic group for larger areas is available in just a few cases, it plays only a role in diversity investigations on small scale.
3. Taxonomic, phylogenetic and character diversity. These diversity conceptions, including the systematic, phenetic and cladistic diversity as well as the taxic diversity, are closely interrelated. They are discussed in detail by WILLIAMS & HUMPHRIES (1994, 1996) and FAITH (1994). The term of taxonomic diversity is based on the idea that, in simple words, for instance a system of 2 species of different genera shows a higher diversity than a system of 2 species of the same genus. As a solid taxonomy aims at the reflection of the phylogeny, taxonomic diversity can be defined as an approximation of phylogenetic diversity. The conception of character diversity (or feature diversity), by contrast, is based on the concept that a system is the more diverse the more (genetic, phenetic, functional) features its species show. Feature diversity can be approximated by taxonomic and phylogenetic diversity and is a possible indicator for the potential use of biological diversity (FAITH 1994).
4. Range sizes and degree of endemism. The range sizes of occurring species in a region are an important criterion for qualitative studies: the occurrence of species with small ranges raises the value of a region. One assessment procedure, which is in many respects imprecise, is the determination of the percentage of endemic species , i. e. of species which occur only in the area of investigation. Several disadvantages of this index, particularly with respect to its mapping, are eliminated by newer calculation methods (USHER 1986, WILLIAMS et al. 1994). They are based on the range sizes of all occurring taxa and thus enable a continuous and area-related calculation of the degree of endemism (see below).
5. Share of allodiversity. An important characteristic and quality criterion of the biodiversity within a region is the share of allodiversity, i. e. the organisms introduced by man. It has a significant influence on total diversity in the medium- to long-term as indigenous species are often replaced or eradicated by alien species (see previous chapter).
6. Ecosystem Functions. An aspect, above all recognised in the research of global change, is the relevance of species for the functioning of ecosystems, particularly with respect to global biogeochemical cycles. The ecosystematic relevance as a quality criterion of biodiversity designates in this sense the function of a species or a species community for the ecological integrity of a larger spatial unit.
7. Actual and potential economic value. This aspect represents a central quality criterion from an anthropocentric point of view.
The four last-mentioned criteria can, strictly speaking, not be considered aspects of diversity. It is hardly correct to say that two regions show a different degree of biodiversity because its species differ in the degree of endemism (WILLIAMS & HUMPHRIES 1994). Nevertheless, they are important quality criteria in the comparative evaluation of the biodiversity of regions.
As an example different qualitative aspects of the vascular plant diversity
of the USA are compared in the figure (after Mutke & Barthlott 1999).
While species numbers show a latitudinal gradient and higher values along
the coast and the main mountain systems, family numbers as an indicator
of phylogenetic diversity peak in the south-eastern part of the country.
Endemism and the portion of rare species show highest values in the western
USA, which have a higher diversity of abiotic factors (geodiversity).
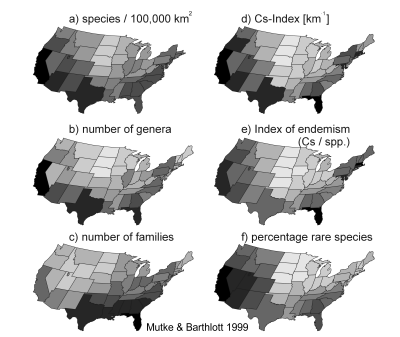 |
Most of the analyses presented
in the figure are based on data from the PLANTS
online database of plants of the USA (USDA & NRCS 1997). Parts
of the data on vascular plants in this database are copyrighted by JOHN
KARTESZ of the Biota of
North America Program (BONAP).
The richness at species, genus and family level is compared in fig. a-c. Species numbers have been calculated for a standard area of 100,000 km2 using the equation by ARRHENIUS (1920, 1921) with z = 0.13. For the numbers of families and genera, no such standardisation technique was applied. As a combined index of endemism and species richness, the reciprocal value of the range size within the USA was summed up for all species. This index of "range size rarity" according to USHER (1986) was interpreted as "Index of specific contribution" (Cs) by KIER & BARTHLOTT (in prep.). The bigger the range size of a species the smaller is its contribution to this index. As the PLANTS database only contains data on the species distributions on the state level, the sum of the area sizes of the states where the species occur is used as area of distribution in the equation of the Cs-Index. |